Siehe auch den deutschsprachigen Artikel zum Thema.
By using management dashboards, your company’s managers will have access to a better overview and more transparency. By dashboards, we mean graphical evaluations that represent certain quantifiable key numbers in charts and make time segments visible through trending. This compiles information into a critical mass in an easily understandable and accessible way.
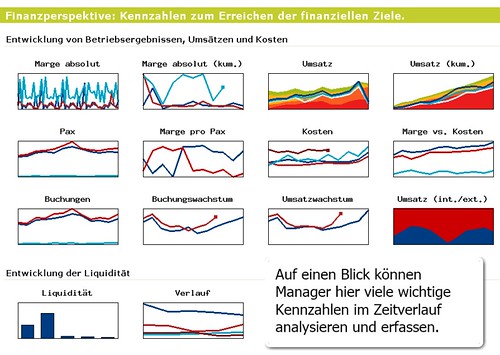
Image 1: Example of a management dashboard
Video presentation of management dashboards
In order to make more clear just how these analyses work, we have created a video (4:57 minutes in length, language German) that shows how management dashboards function:
Video 1: This is how management dashboards work. If you would like to view the video in a new browser window, please click here.
Advantages of management dashboards
//SEIBERT/MEDIA has already created these types of analyses for many companies. In our experience, it leads to the following advantages:
- Advantages for managers
- Managers can easily surf using the web-based interface.
- The websites are loaded quickly and are immediately available (as opposed to “Choose report and wait for it”.
- Reports and analyses are always available and always at the same location.
- Even analyses in old reports are automatically updated.
- There are very few business intelligence systems that can accommodate all kinds of information (e.g., also qualitative). It is easy with a wiki.
- Reports can be improved and corrected. Everything is saved and is thus interactive.
- You can easily pay more attention to controlling information.
- Advantages for organizing data and creating reports
- The organizing of data can be accomplished in a more decentralized manner than with normal business intelligence systems.
- The collecting of data can be easily delegated.
- The analysis and creation of reports can also be accomplished collaboratively. (Advantages: higher quality, fewer mistakes, and correct and matched statements.)
- Comments and proposals made by readers can be added directly and simply.
- For regularly repeating reports, the templates of the last reports can be used and updated repeatedly.
- Analyses in a wiki are automatically generated and can update themselves automatically at a later time – no screenshots or statistical information in reports.
- Reports and analyses can easily be protected using the wiki’s rights management system.
- Every element of the management dashboard can easily be referenced by links using HTML. This makes distribution simple and practical.
Basic requirements for implementation
The basis for the introduction and use in your own company requires merely the following:
- A professional wiki system (e.g. TWiki, Foswiki, or Confluence) that uses a rights configuration system.
- The installation of the necessary analysis plug-ins
- A web browser
- A lot of your time and know-how or a competent advisor
How are these analyses implemented?
The process for implementation as done by //SEIBERT/MEDIA is systematic yet unique for each client:
- Presentation of the standard functions of our management dashboard
We would be happy to explain to you – also in advance by telephone – how management dashboards work and what advantages they could have in store for you. Just give us a call (+49 611 20570 20) or write a request by e-mail. - Tuning of the necessary work for the installation
Of course, you could also undertake much of the work, if you would like. We will give you a short introduction on how to do this. - Group workshop for the defining of the necessary analyses for your company
We have access to a number of analyses that you could simply use for your company. With the help of our templates, new analyses can be quickly and easily established. This results in an individual set of analyses templates for your managers. In addition, different managers can use different analyses (personalization). - Establishing of the solution by //SEIBERT/MEDIA
The implementation is usually quick and easy as we already have many templates. At the beginning, the analyses are filled with example data that you can then easily replace. - The beginning of the manual data organization
At the beginning, you – together with your co-workers – will manually organize the data in the analyses. This proceeds quickly and easily as can be seen in the above video. No programming knowledge is required. The updating is as easy as organizing a simple Excel chart. - Automatization of the data organization
The data tables in wikis are just as simple as CSV files. You can even fill the data tables by importing CSV files. Therefore, you can easily use analyses from foreign systems (e.g. SAP, Business Objects, Excel, Access, and other ERP and BI systems). - Optimization
We recommend a regular review of the management dashboard.
If you would like further information regarding management dashboards in professional wiki systems, or already have and/or use TWiki, NextWiki, XWiki, Confluence, or any other professional wiki system and would like to introduce management dashboards into your company, our consultants will be happy to work with you.
Further information:
Wikis are the glue holding Intranets together
Why there should be a Wiki integrated into every Intranet

 Download (1,1 MB): Our wiki brochure in English (PDF)

Mehr über die Creative-Commons-Lizenz erfahren


Very great written Post, im learning german at this time and i come back very often to your blog, very helpfull the most time.
regards from the uk
There is obviously a bundle to know about this. I assume you made some nice points in features also.